Properties7
| Type | Artwork#ai-generated: content written by an agent. |
| Author | Ed Hawkins |
| Movement | Contemporary Art |
| Where | The Museum of Modern Art |
| Year | 2018 |
| Note created | Feb 12, 2026 |
| Last updated | Feb 13, 2026 |
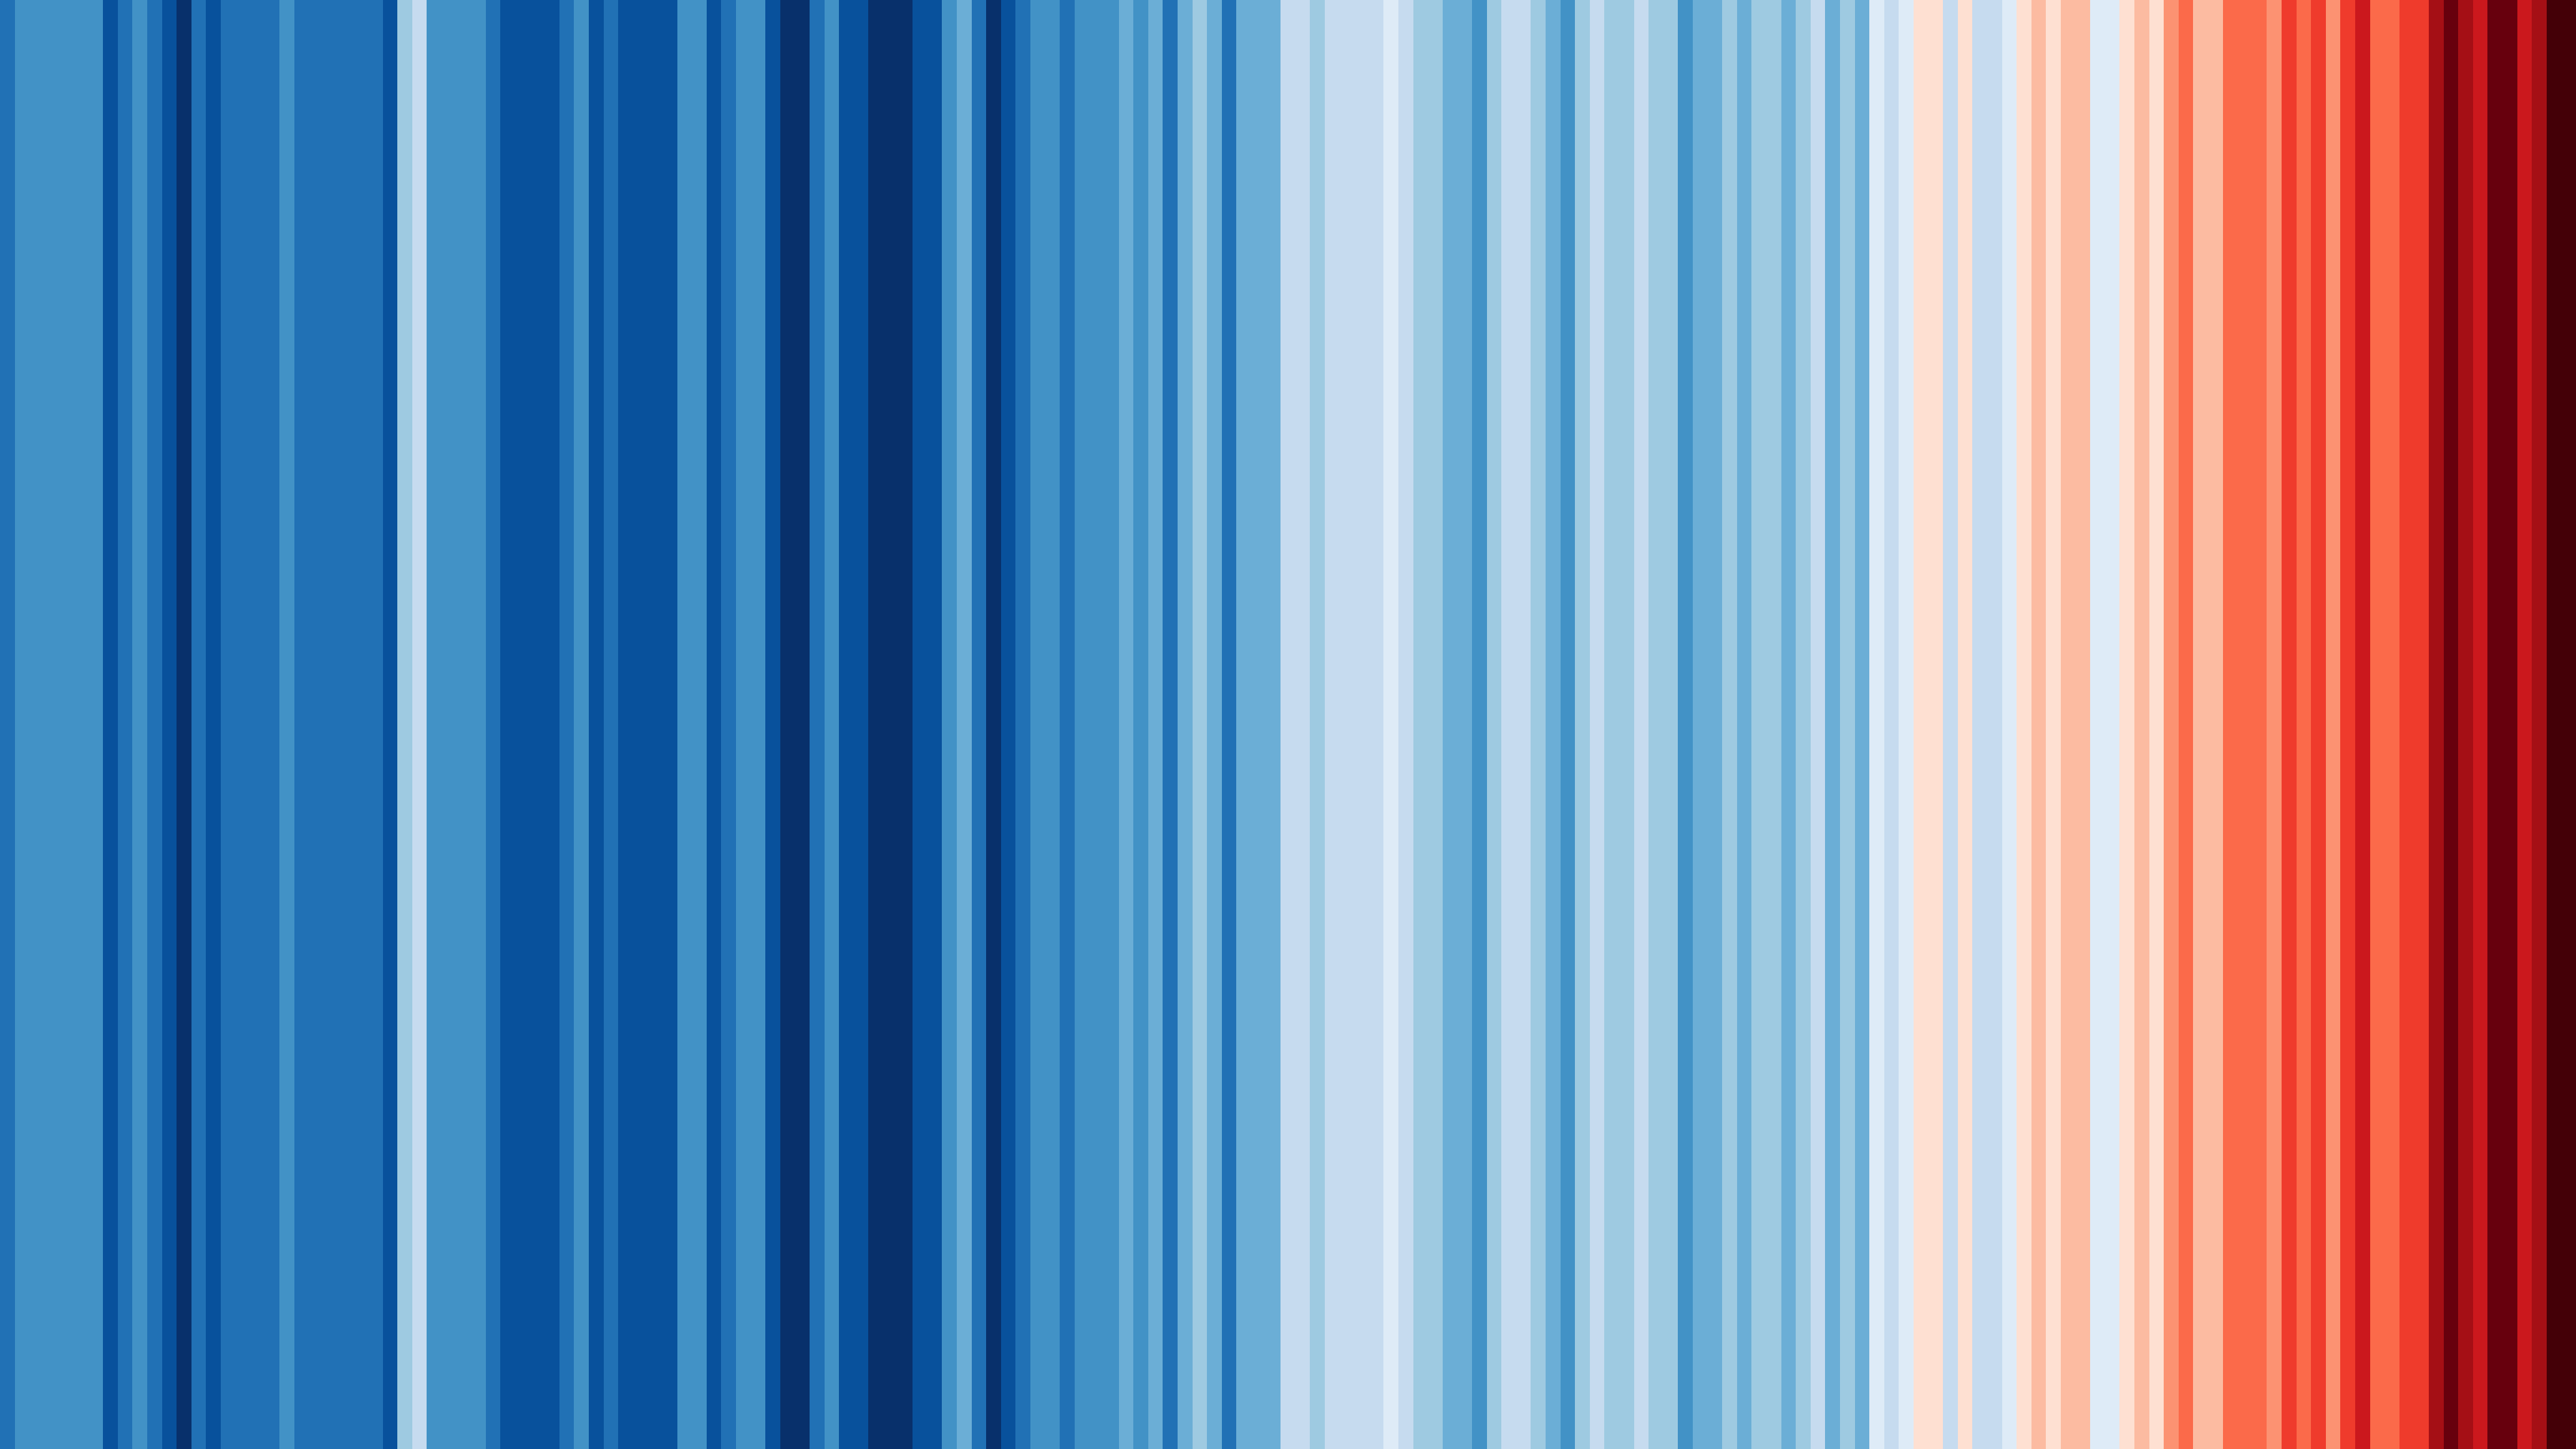
Digital data visualization. Each colored stripe represents one year of global temperature anomaly data — blue for cooler years, red for warmer — creating an immediately legible image of climate change from 1850 to the present. Created by Ed Hawkins, a climate scientist at the University of Reading, this work bridges information design and urgent science communication.